
For most consumers, it’s hard to imagine life without a smartphone. Mobile traffic has increased year on year, with desktop declining. So it’s no wonder that more and more money is spent on mobile advertising. A recent infographic by Connext Digital shows recent trends and statistics in mobile advertising.
For example, the majority of Google’s total US ad revenue comes from mobile. Facebook generates over $15 billion from mobile ads from it’s over 2 billion active users. Checkout the other stats and trends in the infographic below:
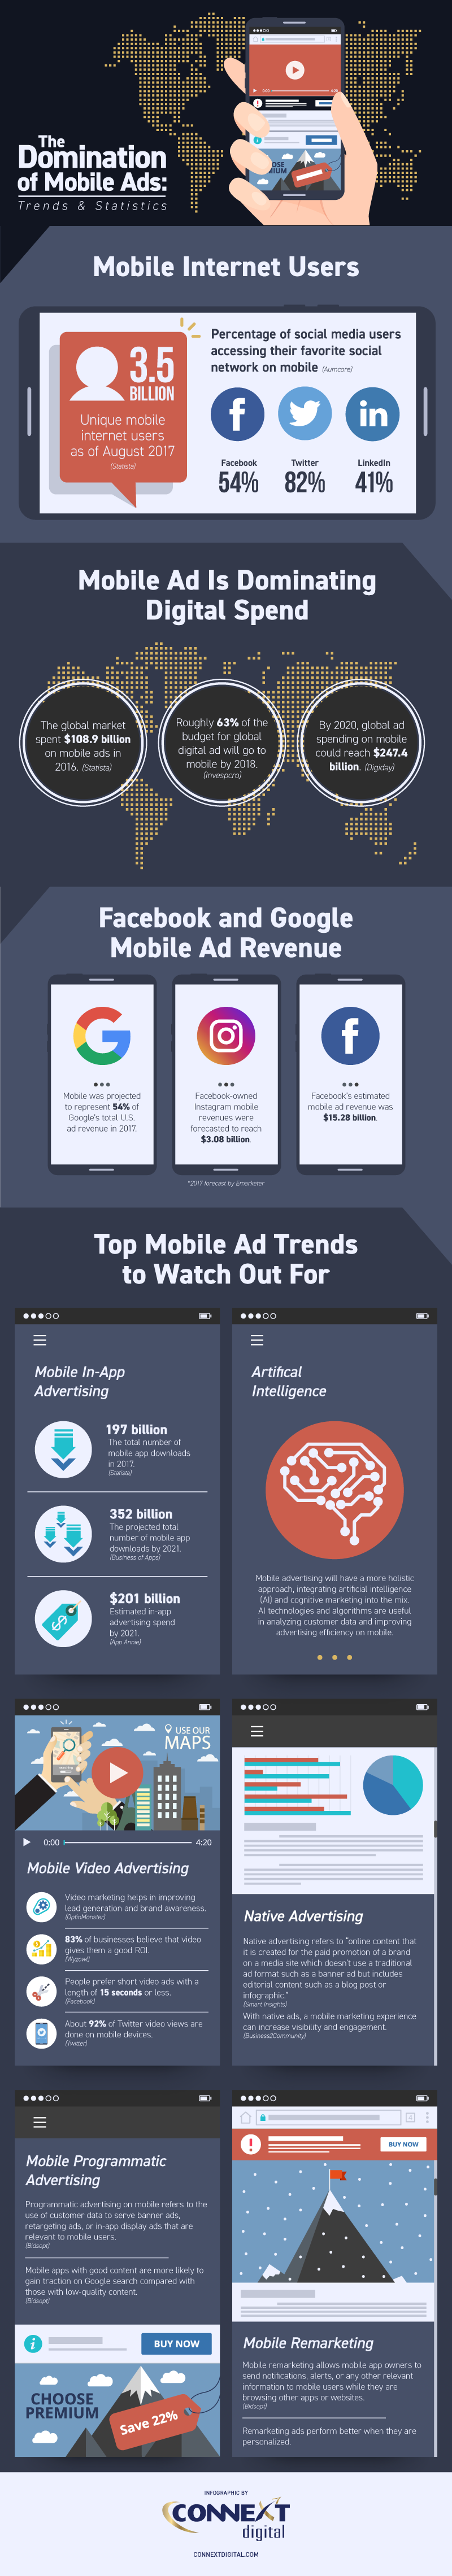
Source: Connext Digital