by Niraj Shah | 4th Feb 2019 | Uncategorized
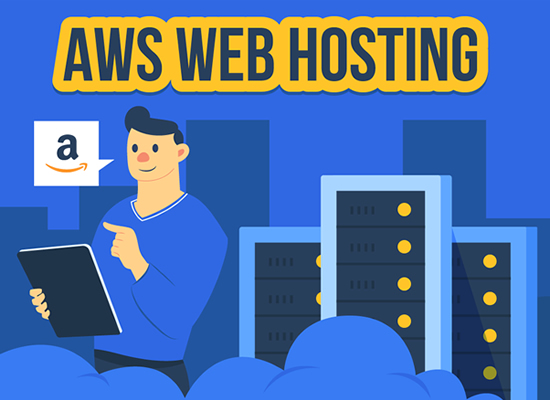
Amazon Web Services (AWS) has been providing web services for 15 years now. Even if you haven’t used AWS directly, you’ll be surprised by just how many services are built on top of AWS. Here is an infographic with some interesting facts and figures from...
by Niraj Shah | 16th Oct 2018 | Uncategorized
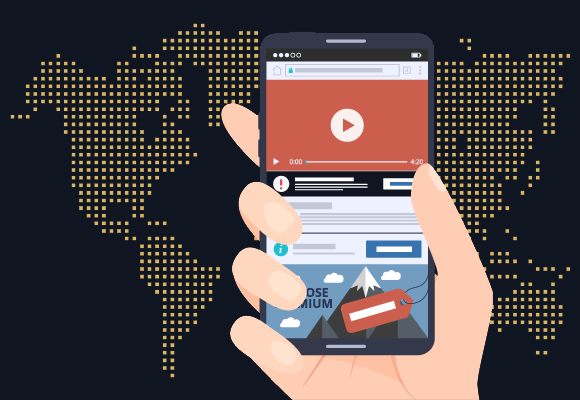
For most consumers, it’s hard to imagine life without a smartphone. Mobile traffic has increased year on year, with desktop declining. So it’s no wonder that more and more money is spent on mobile advertising. A recent infographic by Connext Digital shows...
by Niraj Shah | 23rd Mar 2018 | Uncategorized
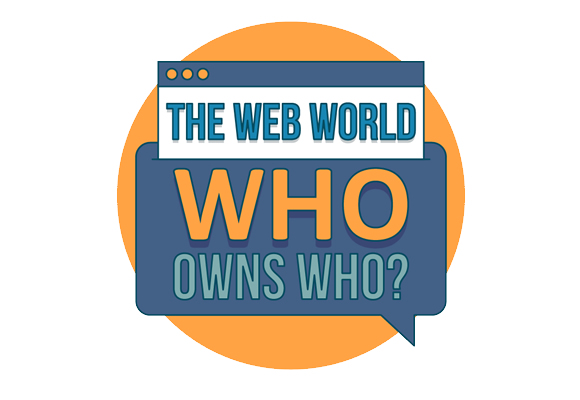
There are lots of big names on the internet, with popular sites like Instagram, Amazon, Twitter, LinkedIn and more dominating most people’s top visited sites. But did you know that most of the sites or apps you use are probably owned by one of a handful of...

by Niraj Shah | 20th Jul 2017 | Uncategorized
Keeping track of the image requirements for the various social networks can be exhausting, especially since they seem to be ever-changing. Luckily, WeAreTop10 commissioned an updated infographic for all the image sizes for the top social networks, including Facebook,...
by Niraj Shah | 27th Oct 2016 | Uncategorized
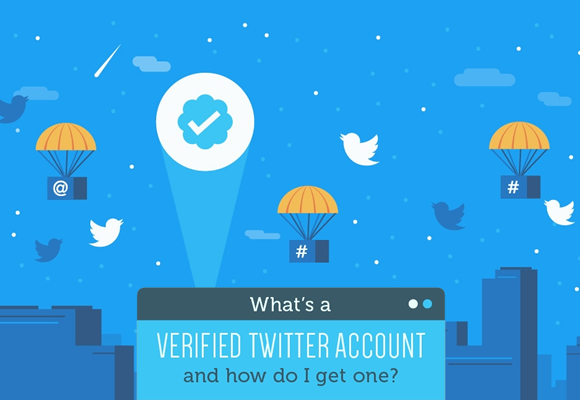
Twitter’s verified account have been around for years, usually reserved for celebrities and popular brands and other important accounts. Twitter now allows other types of accounts to be verified too, including music, television, film, fashion, government,...